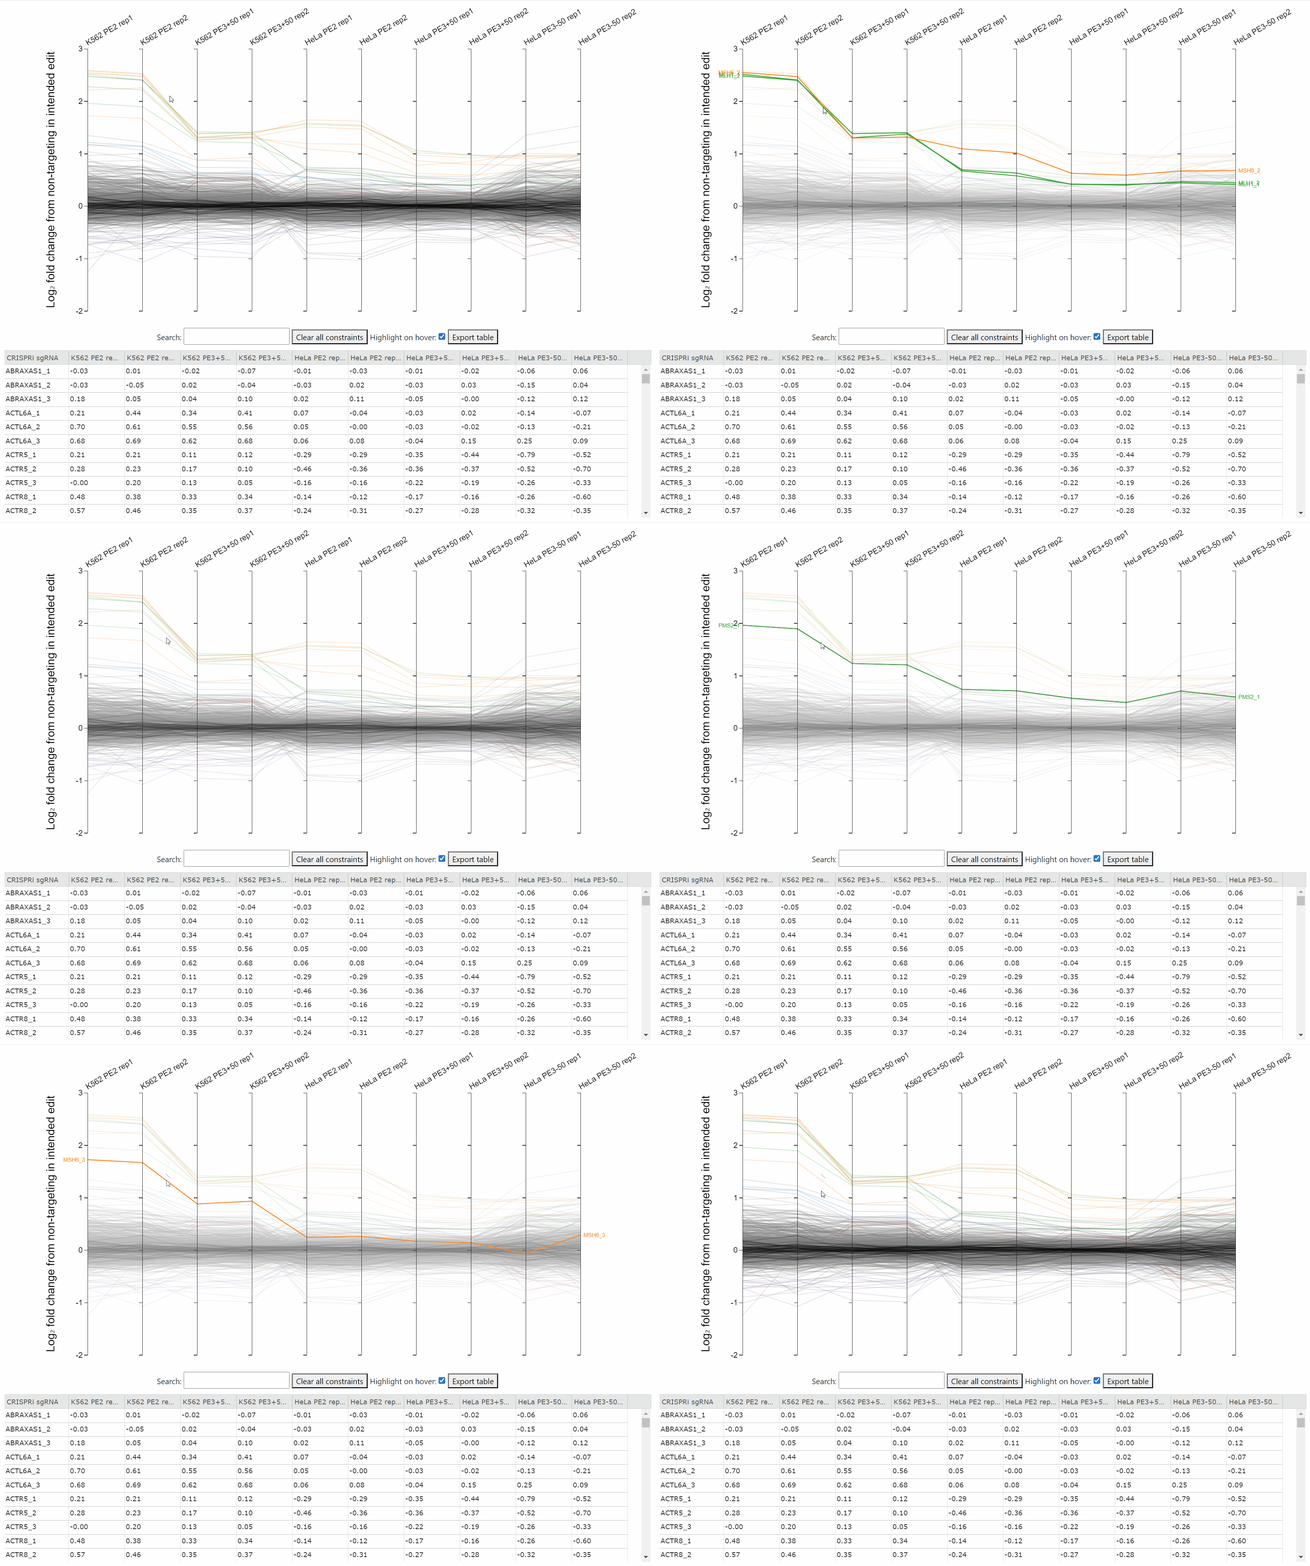
Mouseover a line to highlight and label it.
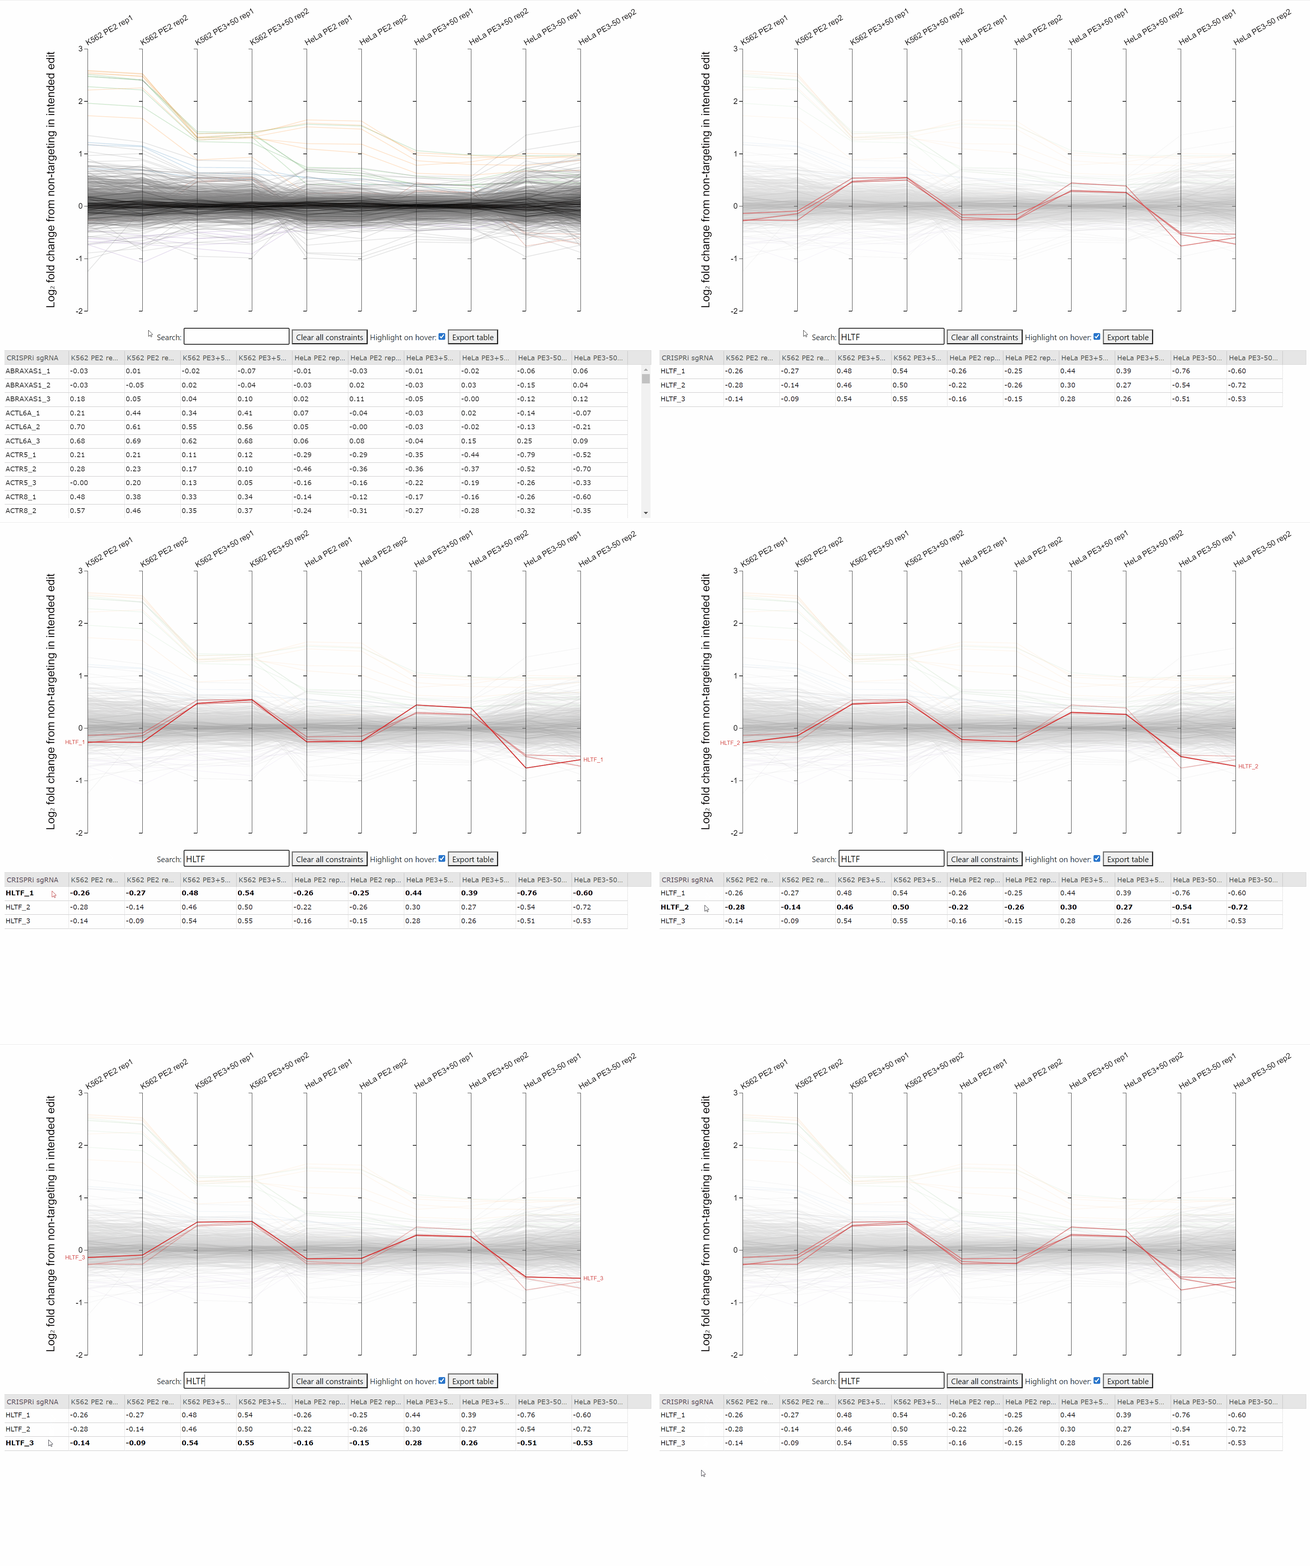
To search for specific sgRNAs, type into the search box and press enter.
Matching sgRNAs will be highlighted and will populate the table below. Mouseover rows in the table to identify corresponding lines.
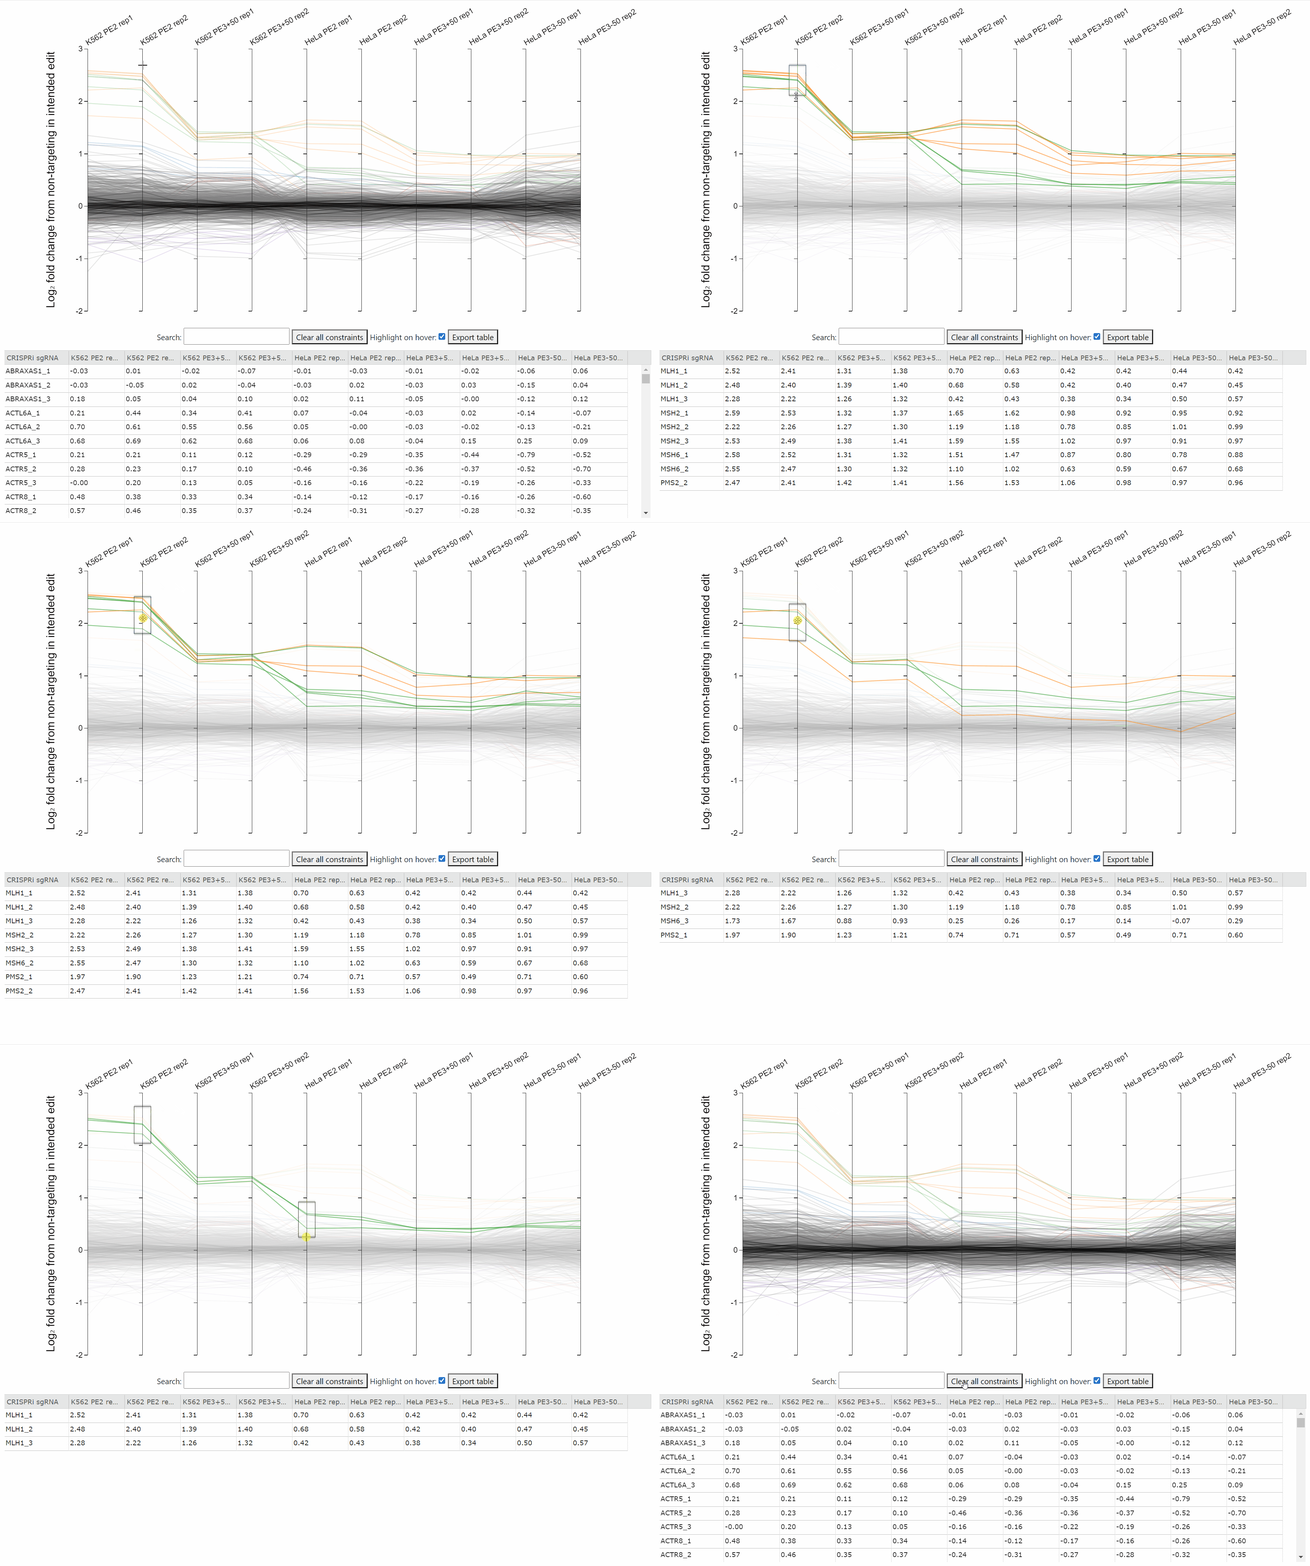
Click and drag on an axis to "brush" a data range, highlighting sgRNAs with values in this range.
Once a brush exists, click and drag on its edge to resize it, or click and drag on its middle to move it.
Brush multiple axes to apply multiple constraints.
Click outside of a brush on an axis to clear that brush. Click the "Clear all constraints" button to remove all brushes.
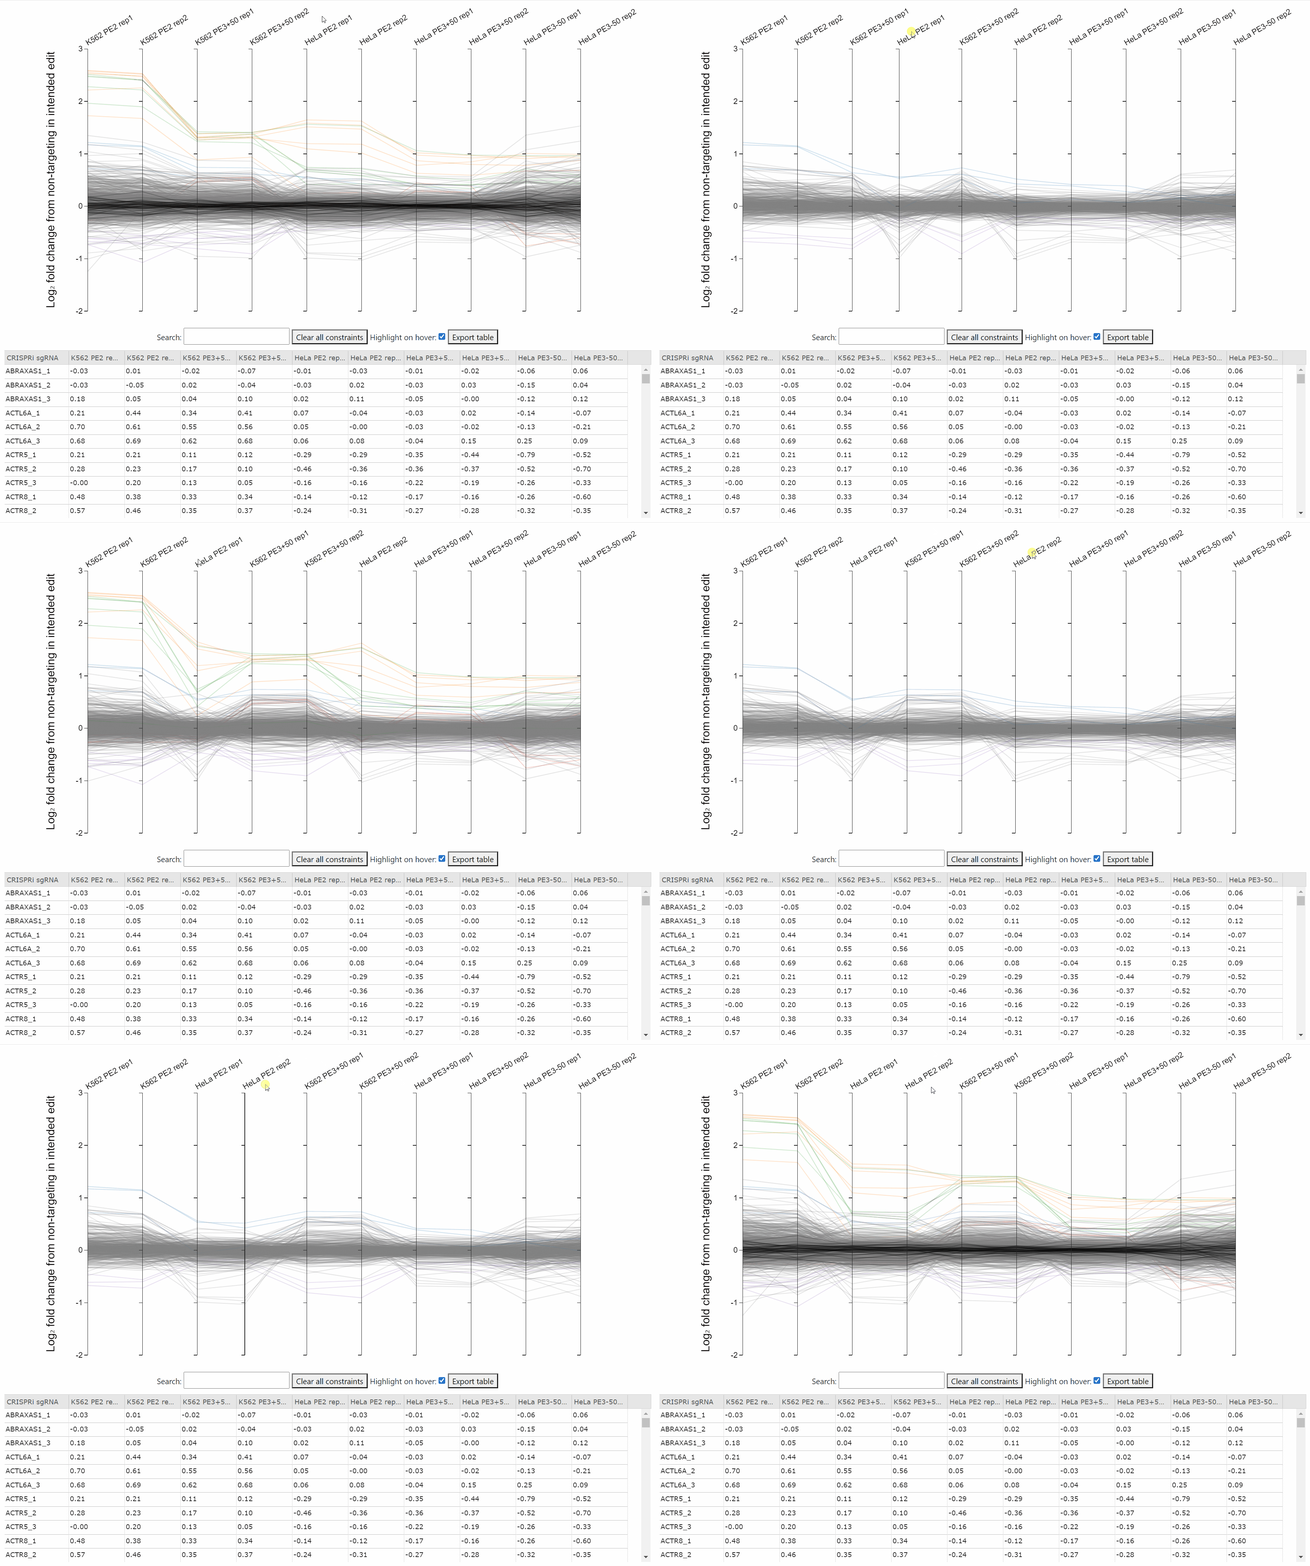
Click and drag on an axis label to reorder axes.
With the mouse positioned over an axis, scroll the mouse wheel to zoom in and out.
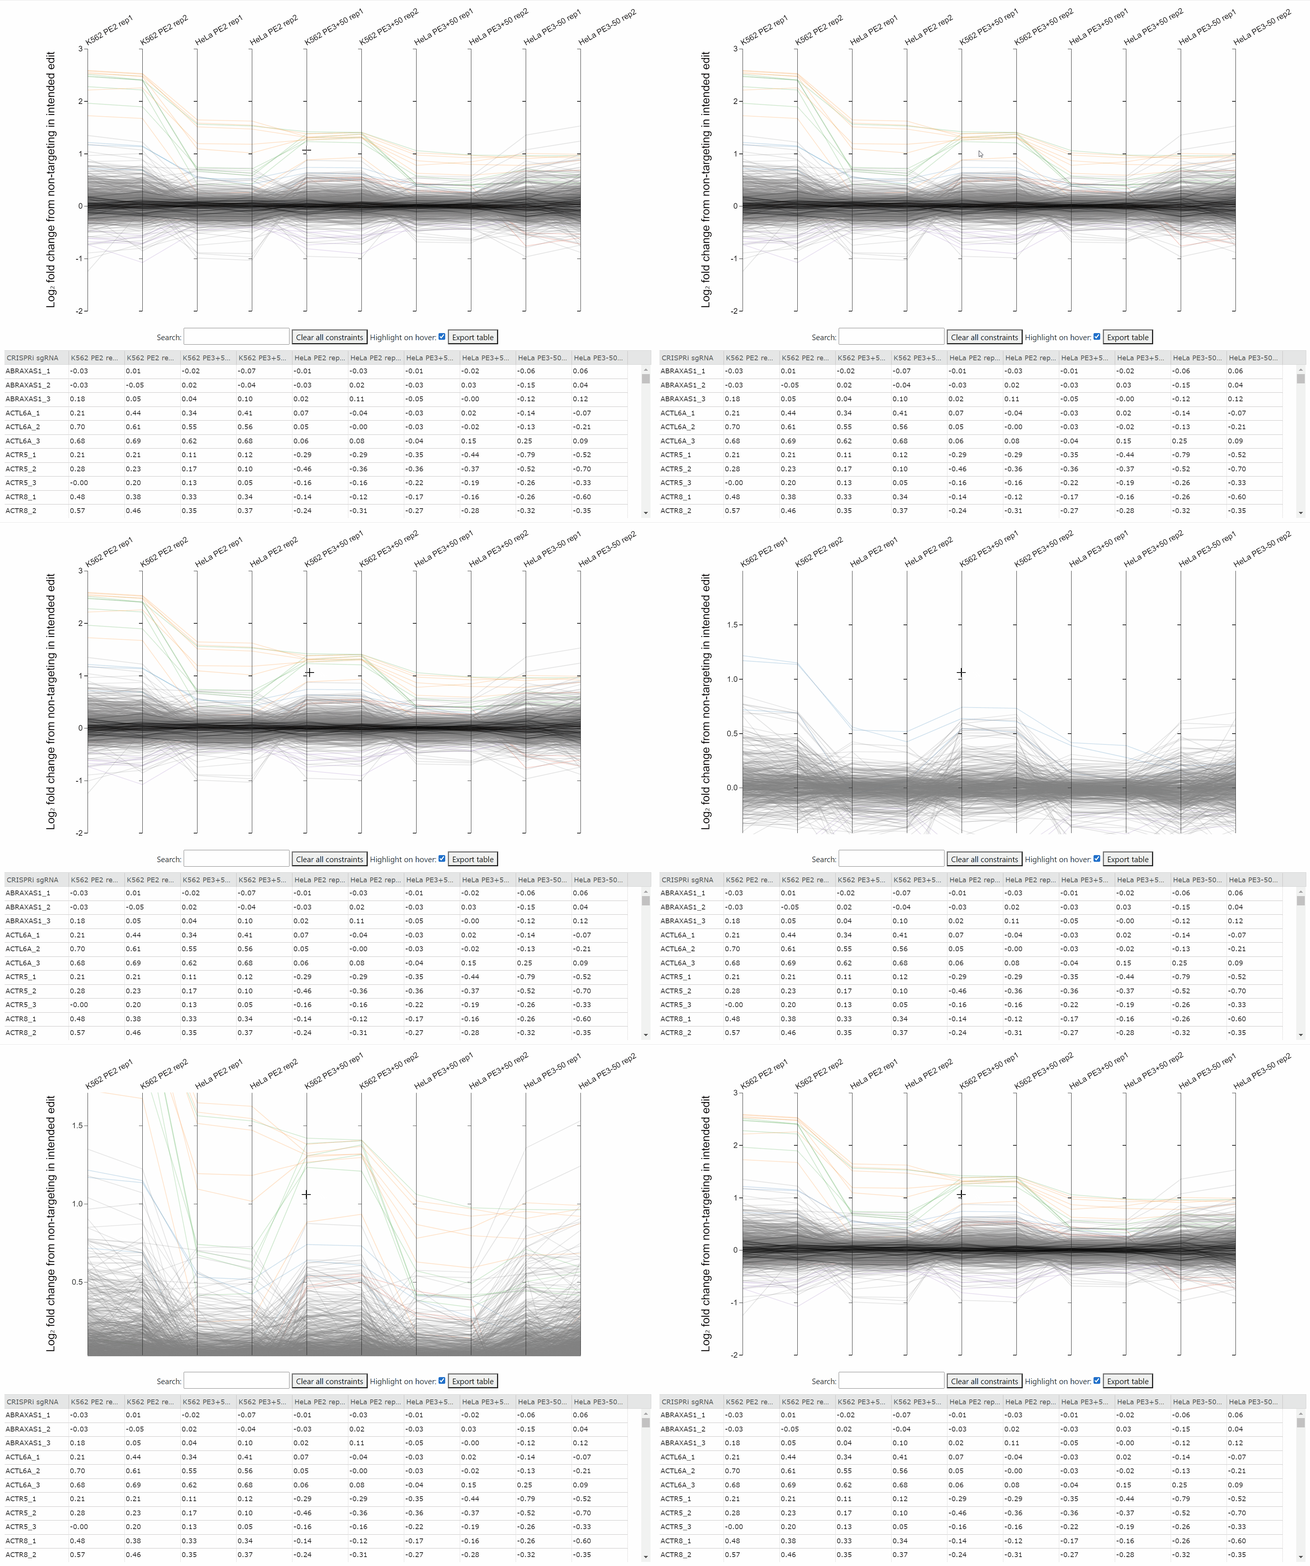
Plots built using D3.js, including adapted code from github.com/syntagmatic/parallel-coordinates, bl.ocks.org/mostaphaRoudsari/b4e090bb50146d88aec4, and bl.ocks.org/jasondavies/1341281.