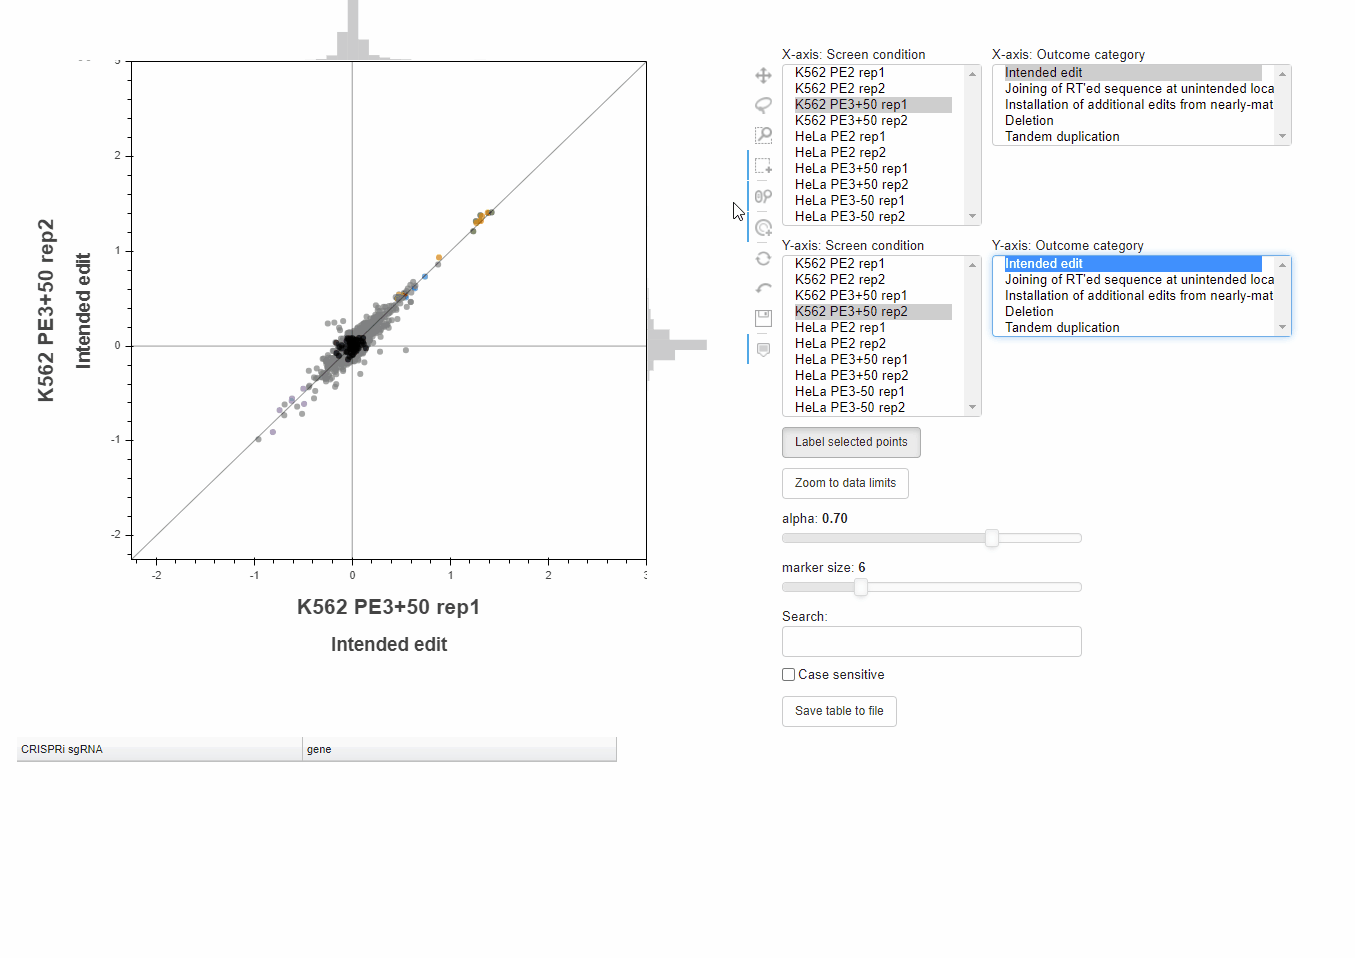
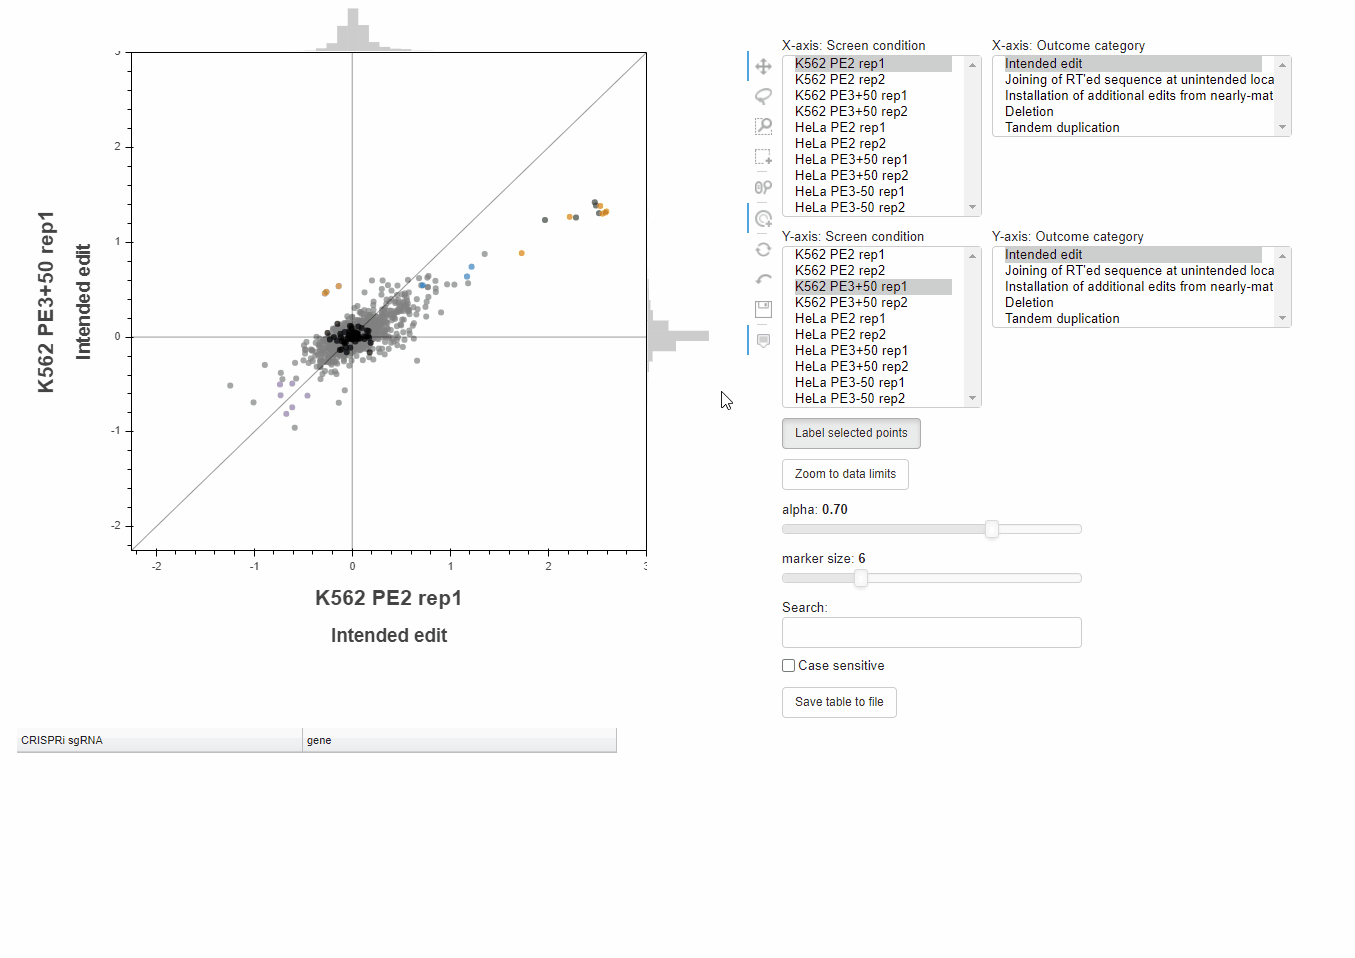
Scatter plots of log₂ fold changes in base editing outcome frequencies
Comparisons of the effects of CRISPRi sgRNAs on log₂ fold changes in the frequencies of different base editing outcomes in different screen conditions.
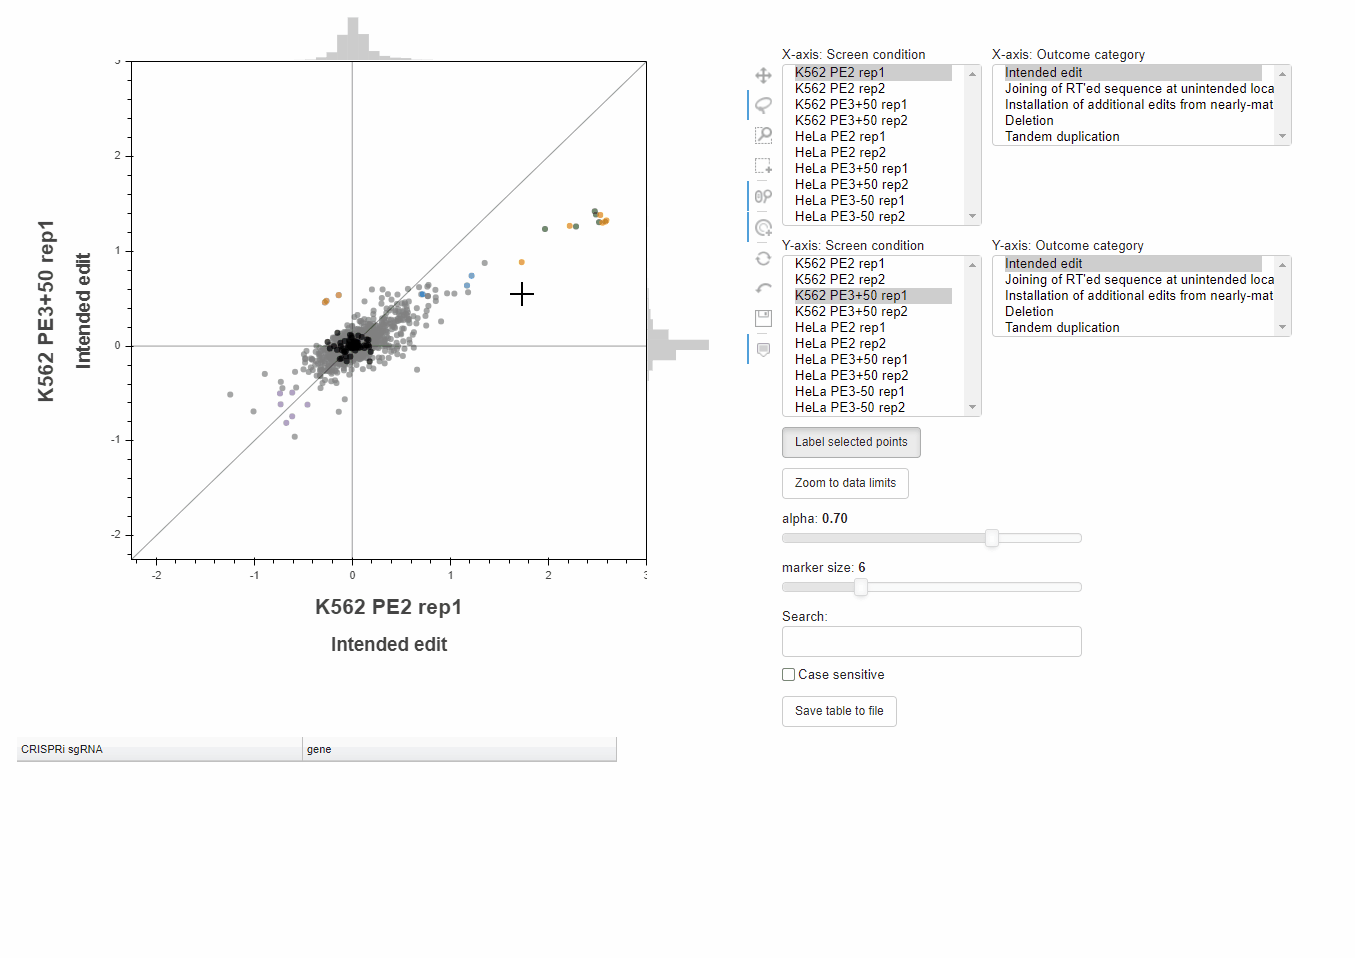
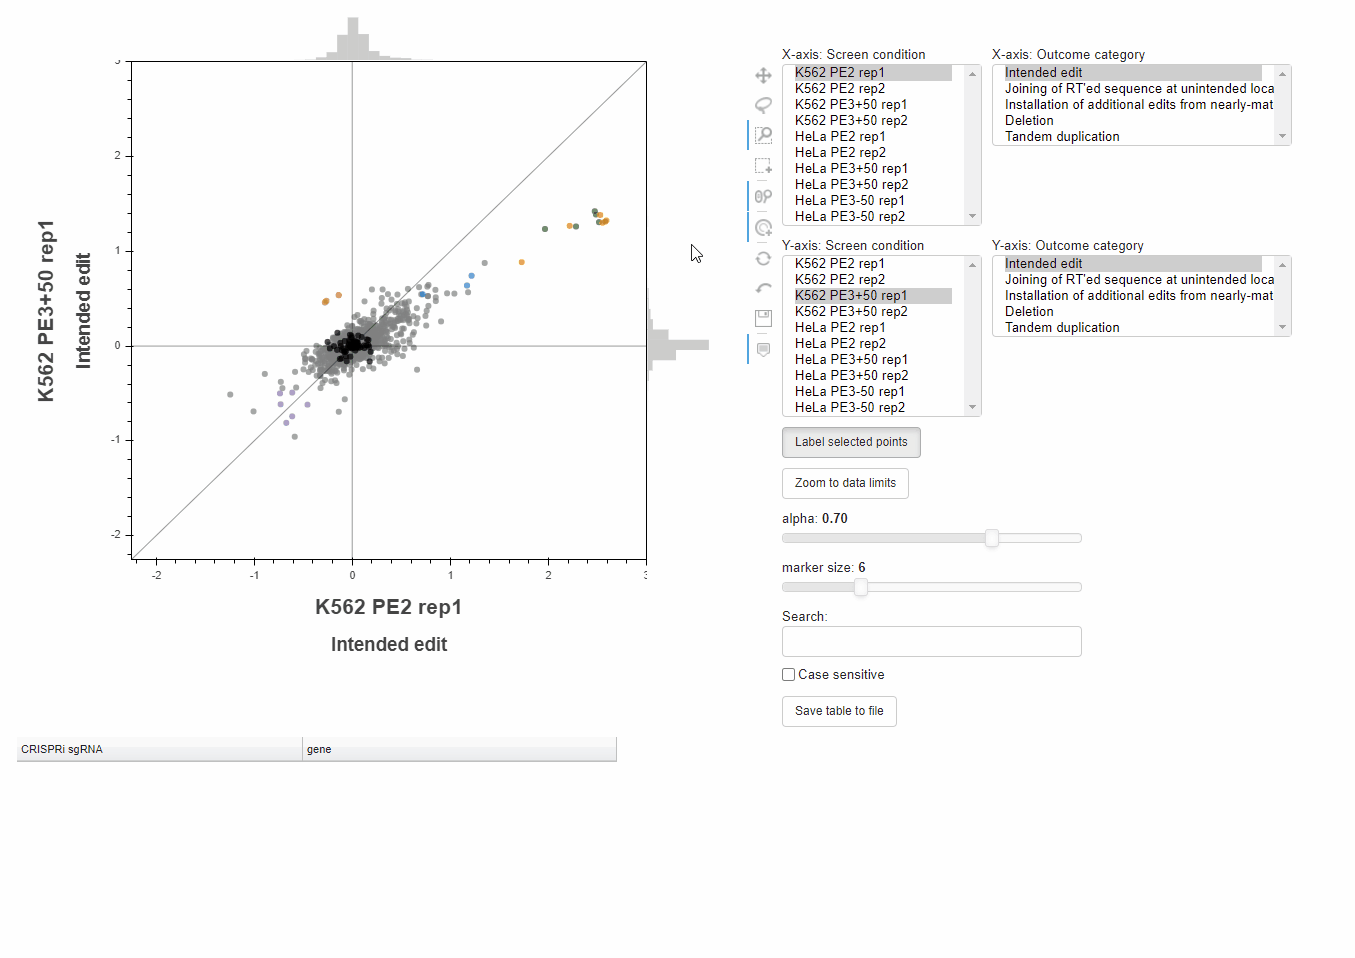
Buttons to the right of the plot toggle different tools for interacting with the plot.
Active tools are marked by a blue bar to the left of the button.
For example, with the "Hover" tool active, hover the cursor over a point to learn which sgRNA it represents.
With the "Tap" tool active, click on a point to select it.
With the "Box select" tool active, click and drag to select all points in a rectangle.
With the "Lasso select" tool active, click and drag to select all points in the traced region.
Finally, type a query into the search field and hit enter to select matching sgRNAs.
With the "Wheel zoom" tool active and the cursor over the plot or either axis, scroll with the mouse wheel to zoom.
Alternatively, with the "Box zoom" tool active, click and drag to zoom in on the selected rectangle.
Click the "Zoom to data limits" button to set the zoom level on each axis to match the range of data for the current datasets.
Click the "Reset" tool to reset the zoom level.
To change the screen or outcome category plotted on the x- or y-axis, click in the relevant menus, or use the up and down arrow keys once a menu is focused.
Highlighting of points will persist as the data source is changed, allowing comparison of phenotypes across conditions or outcomes.